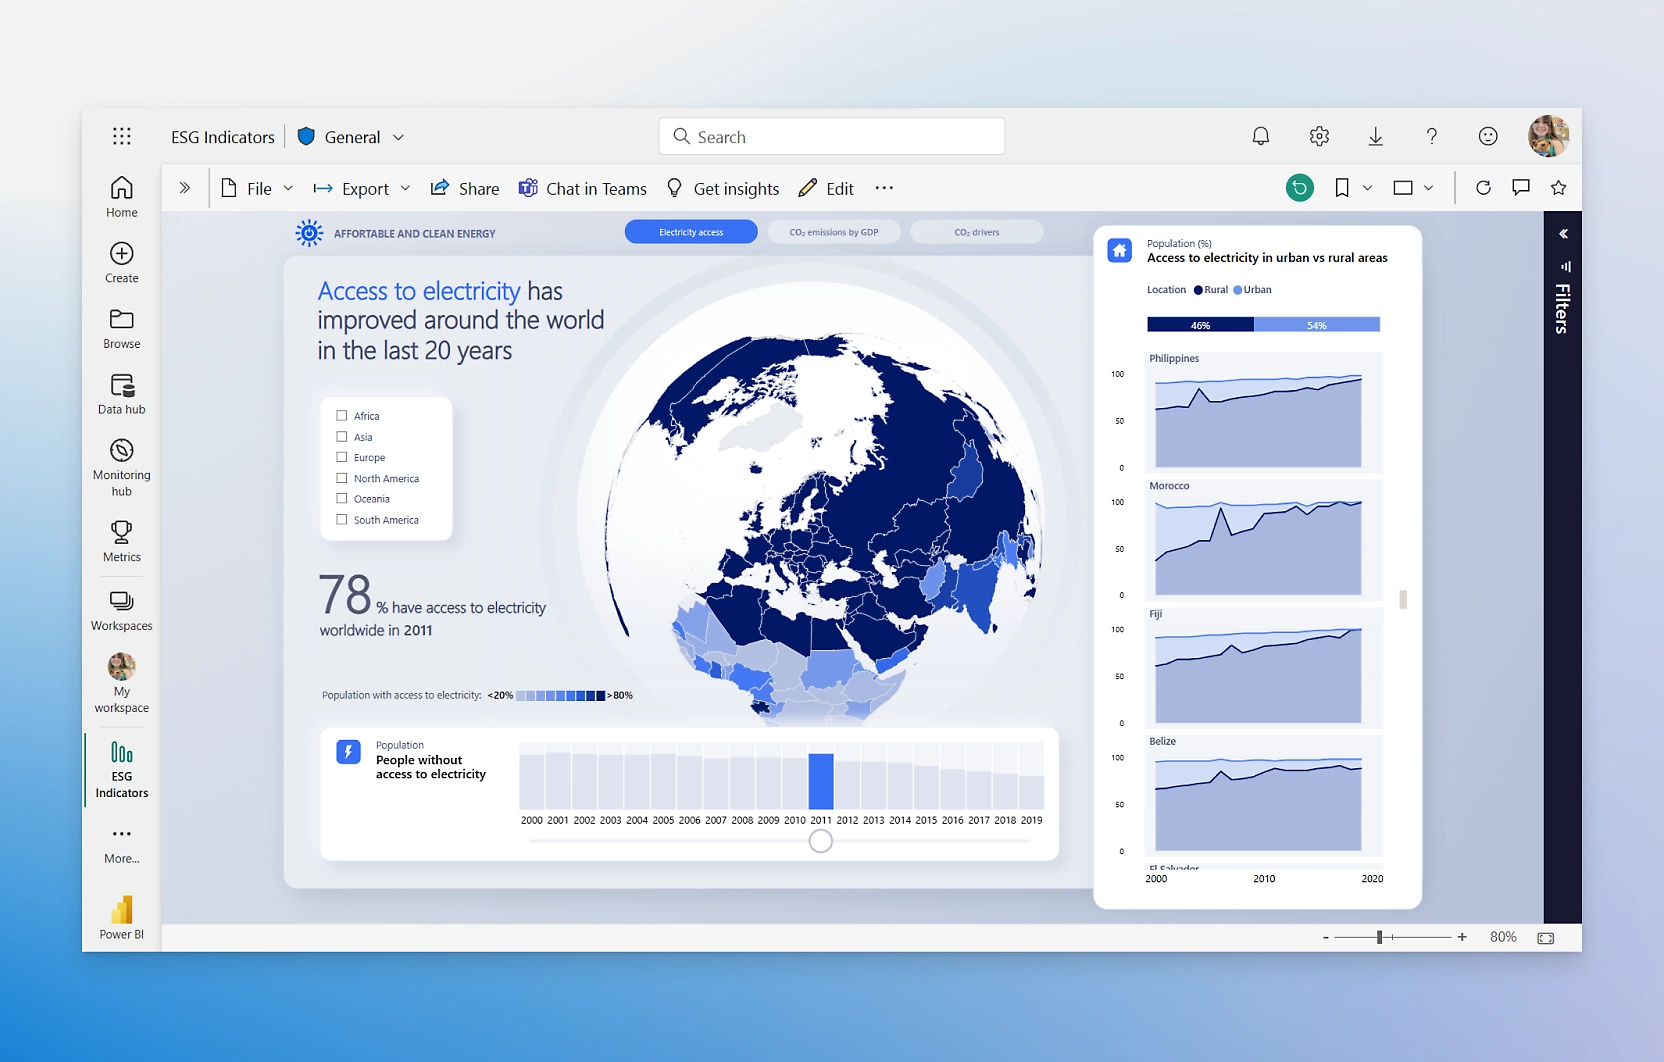
In today’s data-driven world, businesses rely on analytics to make informed decisions. However, many professionals lack coding skills, making it difficult to leverage data effectively. Enter Power BI, a powerful no-code business intelligence tool that enables non-technical users to analyze, visualize, and share insights effortlessly.
With its intuitive interface, drag-and-drop functionality, and AI-driven features, Power BI is transforming how businesses interact with data. This blog explores how Power BI empowers non-technical users and why it is an essential tool for modern organizations.
What is No-Code Data Analytics?
Understanding No-Code Data Analytics
No-code data analytics refers to using software tools that allow users to analyze and visualize data without writing code. These tools provide a user-friendly interface, allowing professionals from various backgrounds to work with data effortlessly.
Why No-Code Analytics is Gaining Popularity
Ease of use – No programming knowledge required
Faster insights – Quick data analysis and visualization
Cost-effective – Reduces dependency on data scientists and developers
Empowers all users – Democratizes data access across the organization
How Power BI Empowers Non-Technical Users
1. Drag-and-Drop Interface for Data Visualization
Power BI simplifies data visualization with its drag-and-drop interface. Users can create interactive dashboards by simply selecting fields and dropping them into a visual canvas. No coding or advanced technical skills are needed.
2. Seamless Data Connectivity
Power BI allows users to connect to various data sources, including Excel, databases, cloud services, and APIs, without requiring SQL or other programming languages. Popular data connectors include:
Microsoft Excel
Google Analytics
SQL Server
Azure Data Services
Salesforce
3. Pre-Built Templates and AI-Driven Insights
Power BI provides pre-built templates that allow users to quickly generate reports for specific business needs. Additionally, AI-driven insights help users detect trends, anomalies, and correlations within their data.
4. Natural Language Processing (NLP) with Q&A
The Q&A feature in Power BI enables users to ask questions in natural language. For example, a sales manager can type “Show me sales performance by region”, and Power BI will instantly generate the relevant visualization.
5. Automated Data Refresh and Scheduled Reports
Non-technical users can schedule automatic data refreshes to keep their reports updated without manual intervention. Scheduled reports ensure that stakeholders always have access to the latest data.
6. Power BI Mobile App for Anywhere Access
With the Power BI mobile app, users can access their reports and dashboards from smartphones and tablets, ensuring real-time decision-making on the go.
Business Use Cases of No-Code Power BI
1. Sales Performance Analysis
Sales managers can track revenue, customer acquisition, and market trends with real-time sales dashboards, enabling better forecasting and decision-making.
2. Marketing Campaign Performance
Marketers can analyze campaign effectiveness, social media engagement, and ROI using Power BI’s marketing analytics dashboards.
3. HR Analytics for Employee Performance
HR teams can monitor employee engagement, retention rates, and performance metrics without needing a data scientist.
4. Financial Reporting and Forecasting
Finance teams can create profit & loss statements, cash flow reports, and expense analysis dashboards with ease.
Benefits of Using Power BI for No-Code Analytics
1. Empowers Non-Technical Users
Power BI removes the dependency on IT teams, allowing business users to independently create reports and analyze data.
2. Improves Decision-Making
With real-time insights, companies can make data-driven decisions faster, reducing guesswork and improving efficiency.
3. Reduces Costs
By eliminating the need for expensive BI developers and data analysts, businesses can save on operational costs.
4. Enhances Collaboration
Power BI allows teams to share reports seamlessly via Microsoft Teams, SharePoint, and email.
How to Get Started with Power BI as a Non-Technical User
Step 1: Download and Install Power BI Desktop
Visit the Microsoft Power BI website and download the desktop version to start creating reports.
Step 2: Connect to Your Data Source
Use built-in connectors to link Power BI to your Excel sheets, databases, or cloud services.
Step 3: Create Your First Dashboard
Use the drag-and-drop feature to build interactive visualizations and customize reports based on your needs.
Step 4: Publish and Share Insights
Once your report is ready, publish it to Power BI Service and share it with your team.
FAQs
1. Do I need coding knowledge to use Power BI?
No, Power BI offers a no-code environment where users can analyze data using a simple drag-and-drop interface.
2. Is Power BI free to use?
Yes, Power BI Desktop is free. However, Power BI Pro and Premium offer advanced features like sharing and collaboration.
3. Can Power BI integrate with Excel?
Yes, Power BI seamlessly connects with Excel, allowing users to import and analyze spreadsheet data effortlessly.
4. How secure is Power BI for business data?
Power BI follows Microsoft’s enterprise-grade security, ensuring data encryption, role-based access, and compliance with industry standards.
5. Can I use Power BI on mobile devices?
Yes, Power BI has a mobile app for iOS and Android, allowing users to access reports anytime, anywhere.


