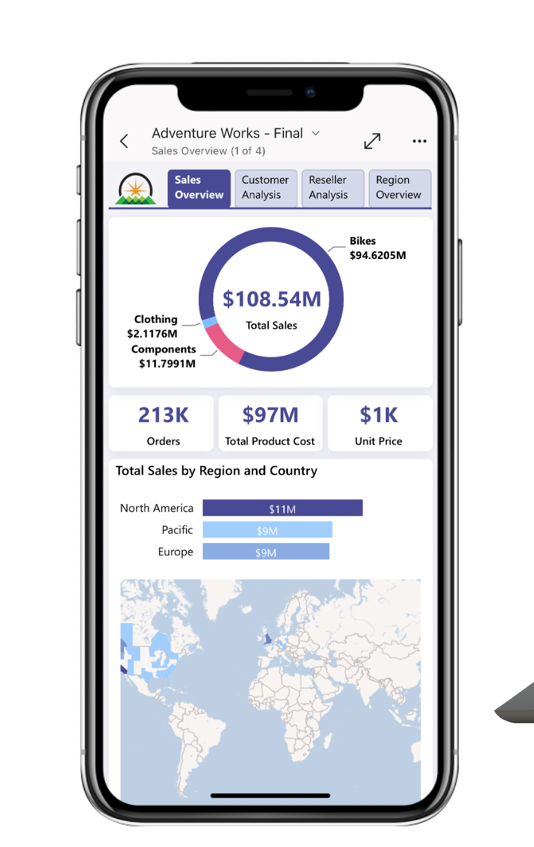
How to Seamlessly Integrate Excel with Power BI for Enhanced Data Analysis
In today’s data-driven world, businesses rely heavily on tools like Excel and Power BI to manage, analyze, and visualize data. While Excel has been a go-to tool for years, Power BI brings advanced analytics and dynamic visualization capabilities to the forefront. By integrating Excel with Power BI, you can unlock a more powerful data analysis experience, combining the best of both tools. In this blog, we’ll walk you through the benefits of this integration and how to seamlessly integrate Excel with Power BI to enhance your data analysis.
Why Integrate Excel with Power BI?
Excel is an indispensable tool for managing and manipulating data, but when it comes to advanced analytics and interactive dashboards, Power BI takes it to the next level. The integration allows businesses to:
- Leverage Excel’s Familiarity: Use familiar Excel formulas, pivot tables, and data manipulation techniques within Power BI.
- Enhanced Data Visualization: Transform static Excel spreadsheets into dynamic, visually compelling dashboards with Power BI’s advanced visuals.
- Real-Time Data Insights: Connect to live data sources in Power BI, ensuring your Excel data and reports are always up to date.
- Advanced Analytics: Utilize Power BI’s DAX formulas and machine learning integration for deeper insights that Excel alone cannot provide.
- Collaboration & Sharing: Easily share interactive Power BI reports with colleagues, clients, and stakeholders through the Power BI service.

Now, YouTube creators and businesses alike benefit from sharing a mix of long and short content—all on one platform. The wide array of video marketing channels means that your strategy needs to be flexible. Each platform—whether it’s YouTube, Instagram, Facebook, LinkedIn, or your website—has its own best practices for video. Choosing to create either short-form videos or long-form videos isn’t really an option if you want your content strategy to be successful in 2023 and beyond. Both long-form and short-form videos have their place in your content plan. Keep reading to learn more about each type of video content and when you should use them for your business.
Step-by-Step Guide to Integrating Excel with Power BI
1. Prepare Your Excel Data
The first step is to ensure your Excel data is clean and structured. Power BI works best with well-organized data that follows a table format. If your data isn’t already in table form, select your data range and click on Insert > Table in Excel.
2. Upload Excel Files to Power BI
There are multiple ways to import your Excel data into Power BI. The most common method is to upload the Excel file directly from your local system or OneDrive.
- From Local File: In Power BI Desktop, click on Home > Get Data > Excel, and browse to your file.
- From OneDrive: If your data is stored on OneDrive, go to Home > Get Data > Web and connect to your file directly, ensuring live synchronization.
3. Transform Data Using Power Query
Before visualizing your data in Power BI, you may need to clean or transform it. Power BI’s Power Query editor allows you to filter, merge, and adjust your Excel data, making sure it’s in the right shape for analysis.
- Remove duplicate entries
- Replace missing data
- Merge multiple Excel sheets if necessary
4. Build Interactive Dashboards
Once the data is loaded into Power BI, the next step is to create interactive visuals. You can use a wide variety of charts, graphs, and tables to visualize your Excel data. The drag-and-drop functionality of Power BI makes it easy to create visually compelling reports.
- Pivot Tables and Charts: You can replicate and improve upon Excel’s pivot tables and charts by using Power BI’s visualizations, which are much more dynamic.
- Custom Dashboards: Create custom dashboards where users can filter, drill down, and interact with the data in real time.
5. Use DAX for Advanced Calculations
Power BI uses Data Analysis Expressions (DAX), a formula language like Excel but far more powerful for advanced calculations. Whether you need to calculate year-over-year growth, apply conditional logic, or create complex aggregations, DAX enhances your ability to extract insights from data.
6. Publish & Share Your Reports
Once your interactive dashboard is complete, you can publish your Power BI reports to the Power BI Service, where it can be shared with your team. You can also embed your Power BI reports into Excel itself, allowing you to view your Power BI reports directly in Excel.
Key Benefits of Integrating Excel with Power BI
- Advanced Visualizations: Go beyond basic charts and graphs with Power BI’s rich visuals.
- Real-Time Updates: Sync your data automatically for real-time reporting.
- Scalable: Handle large datasets with ease, far beyond Excel’s limits.
- Collaboration: Share your reports easily and securely within and outside your organization.
Frequently Asked Questions (FAQs)
Q1. How do I know if my Excel file is compatible with Power BI?
Most Excel files, especially those structured as tables or containing pivot tables, are compatible with Power BI. Make sure your data is clean and organized in rows and columns for best results.
Q2. Can I refresh my Excel data in Power BI?
Yes! Power BI allows you to set up automatic refreshes. If you’re using a cloud service like OneDrive, Power BI can sync your data, ensuring you always have the latest updates.
Q3. Is Power BI more powerful than Excel for data analysis?
While Excel is highly capable for basic to intermediate analysis, Power BI excels (pun intended) in large-scale data analysis, real-time insights, and interactive reporting.
Q4. How much does Power BI cost?
Power BI offers a free version with limited functionality and a Pro version starting at around $9.99/user/month. There’s also Power BI Premium for larger organizations needing enterprise-level features.
Q5. Can I embed Power BI reports into Excel?
Yes! Power BI allows users to embed their reports back into Excel, providing a seamless experience between both tools.


